Today, we’re looking at yet another example of how mindful scaling, the right tools, and a clear strategy can deliver a seriously solid result.
This time, it started with a modest ad budget. Still early in their journey with the ProPush Constructor, the publisher sent Facebook traffic to Constructor-built landing pages and earned $1,581 while maintaining a strong ROI. It’s a promising start with plenty of room to grow.
Keep reading to discover our publisher’s winning strategy, the creatives that worked, the optimization steps he took, and some genuinely useful tips for getting the most out of the Constructor.
But first, here’s a quick overview of what we’re dealing with today:
Here is how he described it himself:
"Over the past three months, I have been testing and optimizing Facebook traffic with ProPush.me's Constructor to find combinations of traffic sources, GEOs, creatives, and campaign settings that could consistently generate revenue."
As our publisher explains, it’s all about the speed of the feedback loop:
"I focused on using Facebook because it provides the ability to test different audiences and creatives quickly and scale campaigns when I find a combination that performs well."
Another reason was the mindset Facebook audience was in – it perfectly matched the Constructor’s Social Survey template he chose.
Facebook traffic is curiosity traffic: people scroll, something attracts them, they tap to find out what it was, and the Social Survey flow then asks a few light social questions that a curious visitor will answer without a second thought.
The offer page also gave him a clear idea of how to approach creatives:
"Social Survey Constructor tends to make sure users interact with social-related questions, and since the offer page contains questions about the user's age, gender, and relationship status, this gave me an idea of the style of creatives that will likely perform."
We’ll come back to the creatives shortly. But first, let’s take a look at his campaign targeting.
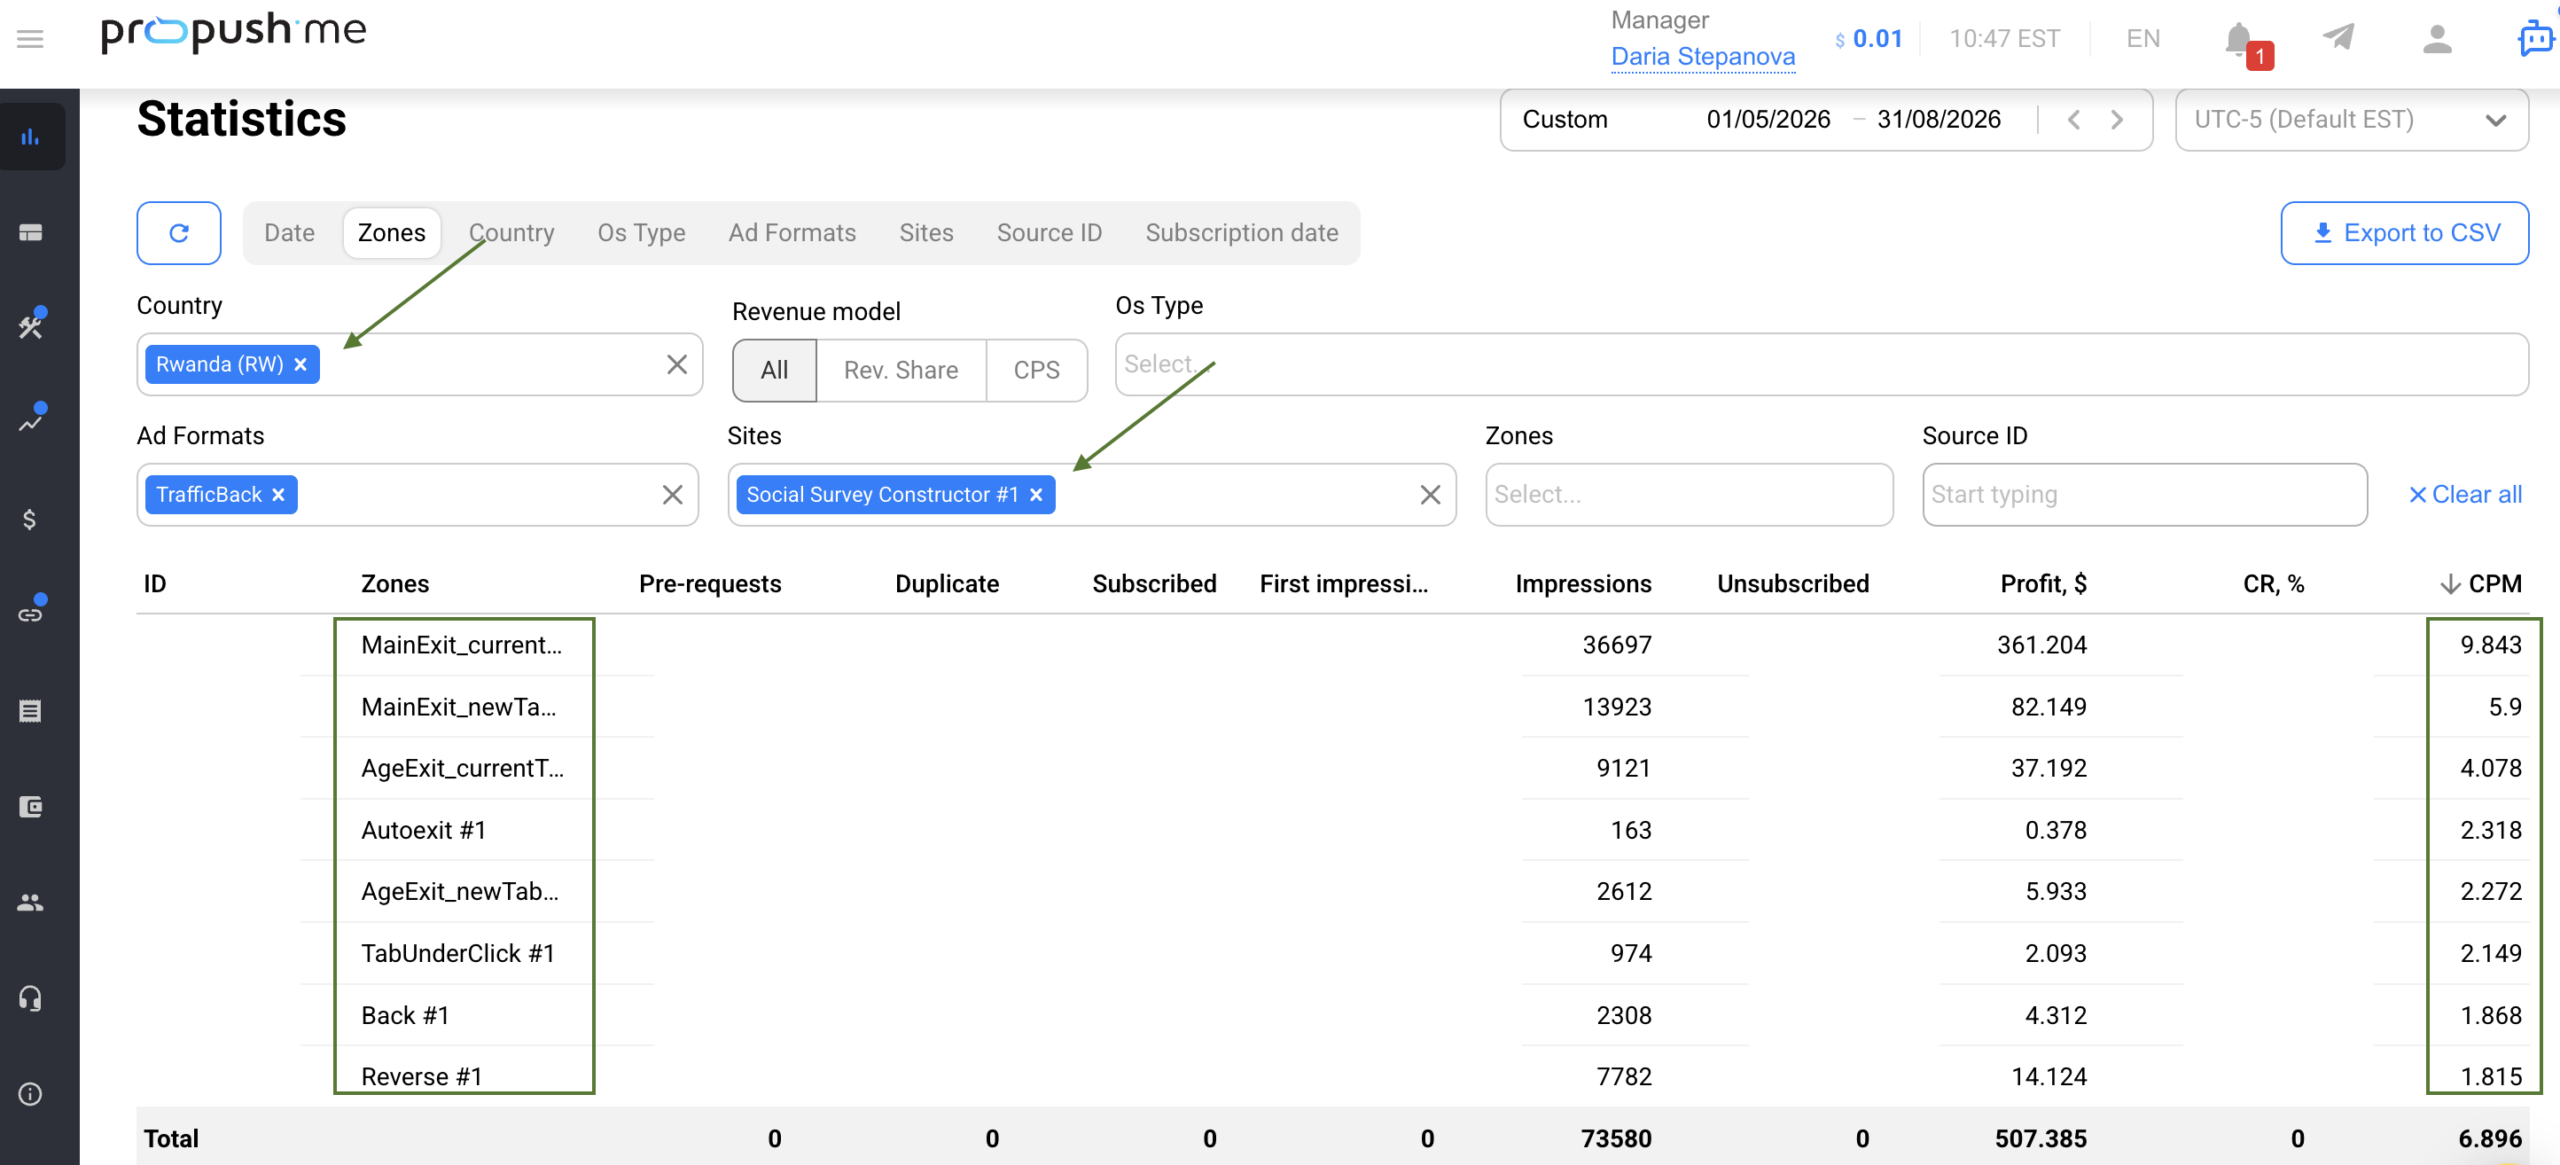
The GEOs our publisher decided to focus on were Mozambique and Rwanda.
That doesn’t mean he didn’t test anything else, but those two consistently kept contributing the bulk of both traffic and revenue, so that is where the budget went.
His campaigns targeted Android and iOS users together, with an average CPM of around $6 throughout the period.
So, that $6 CPM became his key benchmark. For example, with RevShare, the rule is simple: the flow needs to earn more than the traffic costs. This helped him determine the maximum he could afford to pay for each result before launching a campaign.
Now that we’ve covered the GEOs, let’s dive into our publisher’s creative strategy:
"I usually use non-explicit female-focused ad concepts, taking inspiration from the type of content and topics that people already interact with on social media platforms such as Facebook and Pinterest. The main idea is to make the creative captivating and create enough curiosity for the user to click and engage. This is important because the quality of the traffic also affects the cost per result."
Here are a few rules he recommends following:
Strong creatives didn’t just improve the click-through rate. More than that: they also helped lower the cost of traffic.
In his best-performing campaigns, the cost per landing page view dropped to around ₦5 (about $0.003), though it varied considerably by GEO, audience, campaign, and creative.


The screenshots are provided by the publisher
Our publisher shared a detailed breakdown of every step: from the initial campaign setup to optimization and scaling. So, let’s take a closer look at how he structured the process and turned early test results into consistently profitable campaigns.
When launching a new campaign, the publisher didn’t go all-in from day one. Testing the waters with a small budget seemed like a much more sensible approach:
"Starting with a small budget allows me to limit the initial risk while Meta gathers data and optimizes the ad set during the learning phase, which normally takes around 2–3 days. Since the average eCPM on the affiliate network is around $6, I need to maintain a low CPR in order to stay profitable. Spending too much on a newly created ad set can increase the traffic cost before I know whether the combination will work."
Even with this comparatively modest budget, he could get through the unpredictable first few days without overspending, and still collect enough data to judge whether the combination had potential.
As he put it, "the objective at this stage was not immediately to maximize revenue."
Instead, the budget was there to answer a few simple questions:
In other words, the initial $3 cap was not a test of whether the Constructor could generate a profit. It was simply a way to keep spending under control during the first few days while checking the campaign for setup or tracking issues. Any conclusions about revenue potential would come later, after the campaign had collected enough traffic and data.
"After creating my campaigns, I usually leave it for about 8 to 12 hours, which is half of the day, in order to fast-track the performance. During this period, I usually use Ads Manager to check the click-through rate, the landing page views generated, the impressions accumulated on my affiliate network and also the initial CPM. The early check is to decide if the creatives used will perform well in the long run and also bring profit, since the earning mode is revshare. And since the early campaign always has a high CPR, no further changes are made with ads that have a good click-through rate between 18% or above for the next 48 hours."
Two details here are especially important:
This gives Meta enough time to optimize while preventing promising ads from being switched off too early.
"I normally start each campaign with a single ad set and monitor it for around 8–12 hours, or sometimes 24 hours depending on the amount of data coming in. If an ad set is clearly underperforming, I stop it. The ones that perform well are allowed to run for another 2–3 days without making unnecessary changes. This gives the ad set time to go through the learning phase and stabilize before I consider scaling it."
Leaving the best-performing creatives alone is where many advertisers struggle. Editing a live ad set can push it back into the learning phase, so tweaking a promising setup on day one may undo the stabilization you’ve already paid for.
There’s another important number in his answer: one that should shape your testing budget:
"Typically, I test around 3–5 ad sets before identifying a combination that I consider profitable enough to scale."
In other words, don’t budget for a single launch. Plan for around four tests before expecting to find a combination worth scaling.
"I normally allow an ad set to reach around $15–$20 in ad spend before making a scaling decision. This gives me enough information to see whether the CPR is stable and whether the ad set can continue performing profitably."
For him, the green light for scaling is a CPR of around $0.00323 – the ₦5-or-less benchmark from his own reporting:
"After 2–3 days, when I see a CPR of around $0.00323 (approximately ₦5 or less in my results), this gives me enough margin to start scaling. At that point, I normally increase the ad set budget by around 20–30% while monitoring the CPR and overall performance."
Then comes the question of direction. He can scale horizontally by duplicating an ad set that already works, or vertically by increasing its budget with a bid cap:
"Both methods work, but duplicating an already performing ad set within the same campaign can be easier without interrupting the initial CPR or performance, and this works better in my own case. I usually test new creatives when duplicating an ad set within the same campaign. Also, I always duplicate a winning ad set not more than two times to avoid audience fragmentation."
The key here is not to overdo it: he stops at two duplicates. Any more than that, and the ad sets may start competing for the same audience, pushing performance in the wrong direction.
His entire process, in one neat loop:
A working creative can stop being a working creative overnight for reasons that have nothing to do with its performance, and his answer was to always have the next one ready:
"Facebook can also be challenging because advertisements may sometimes be rejected or become unavailable. When this happened, I worked on creating or modifying alternative creatives so that I could continue testing and maintaining traffic flow while staying within the platform's advertising requirements."
He’s referring to Meta’s Advertising Standards, which are definitely worth checking before you build a creative, not after it gets pulled.
Optimization wasn’t something he did on a fixed schedule. As he put it, "when I found an ad set performing better than the others, I used it as a basis for further testing." The stronger ad sets shaped the next round of tests, while weaker creatives were removed before they quietly ate through the budget. Then the cycle started again.
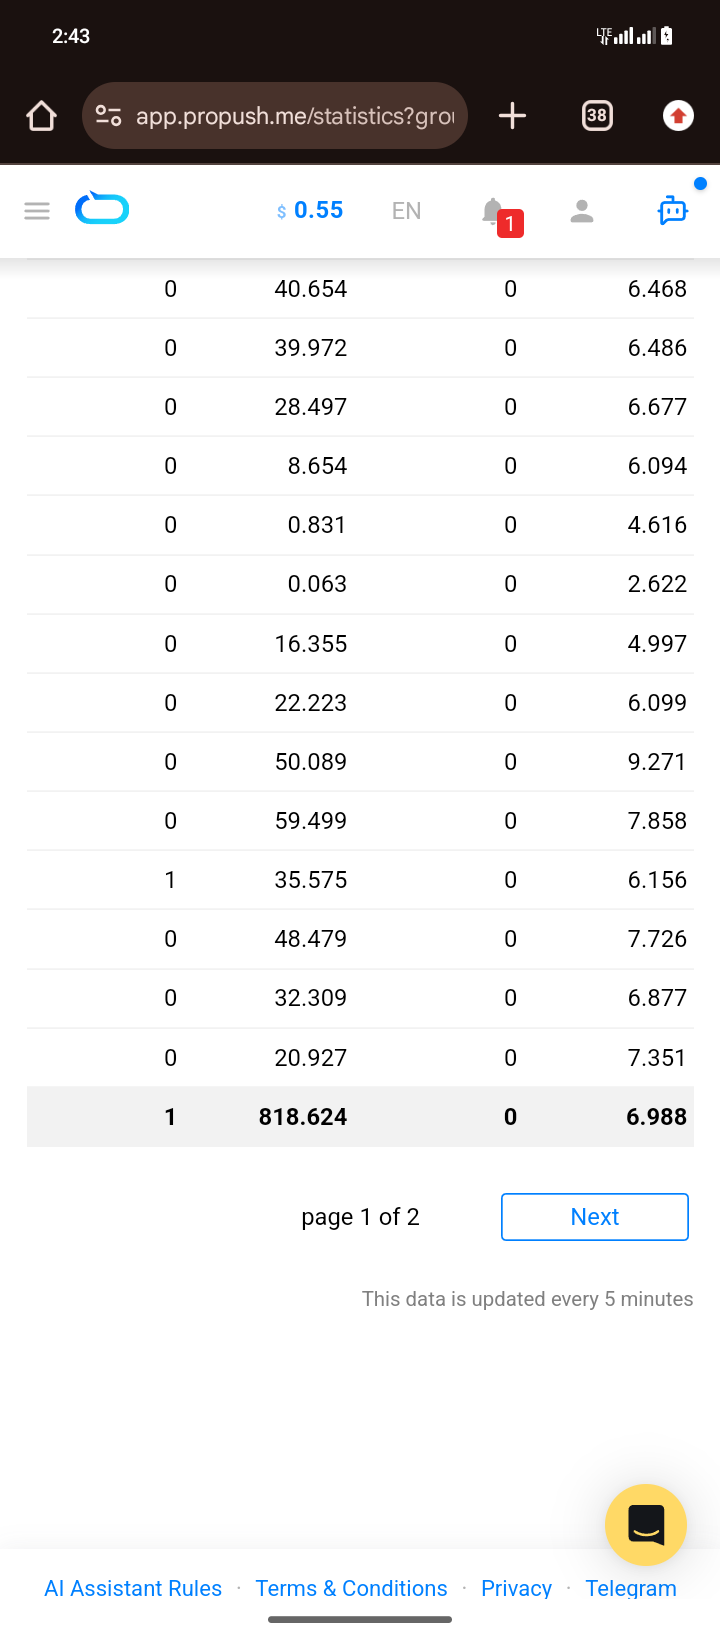
Over roughly 3 months, the campaigns produced $1,581.81 in ProPush earnings at an average CPM of $6.087.
June was the standout month, bringing in $818.62 at a $6.988 CPM. Since the CPM was also above the campaign average, June’s result wasn’t just about traffic volume – the traffic itself was paying better.
The economics of the run:
For campaigns that started at just $3 a day, $1,581 over three months is a pretty solid result. More than half of it came in June, when the setup was already running at its best.
So, what did 3 months of testing and $1,581 in earnings teach him? Let’s hear it from the publisher himself.
1. Start small
"I learned that there is no need to spend heavily before understanding whether a campaign has potential. Starting with a small testing budget allowed me to collect data without taking unnecessary risks."
2. GEO selection matters
"Not every GEO performed equally. Mozambique and Rwanda stood out as some of the strongest GEOs for my campaigns, which taught me the importance of testing multiple countries instead of assuming that one GEO will work for every campaign."
3. Creative testing is critical
"The creative is one of the most important parts of Facebook traffic. A campaign can have a good offer, but if the creative doesn't generate enough curiosity or clicks, the traffic will not be sufficient. Testing different creative angles helped me find better-performing combinations."
4. Don't scale too early
"A campaign showing promising results with a small budget does not automatically mean it is ready for aggressive scaling. I preferred to collect enough data first, identify stronger ad sets, and then increase the budget progressively."
5. Successful campaigns can lead to new tests
"When I found an ad set performing well, I didn't simply leave it running. I tried to look for ideal audiences by duplicating an already performing ad set."
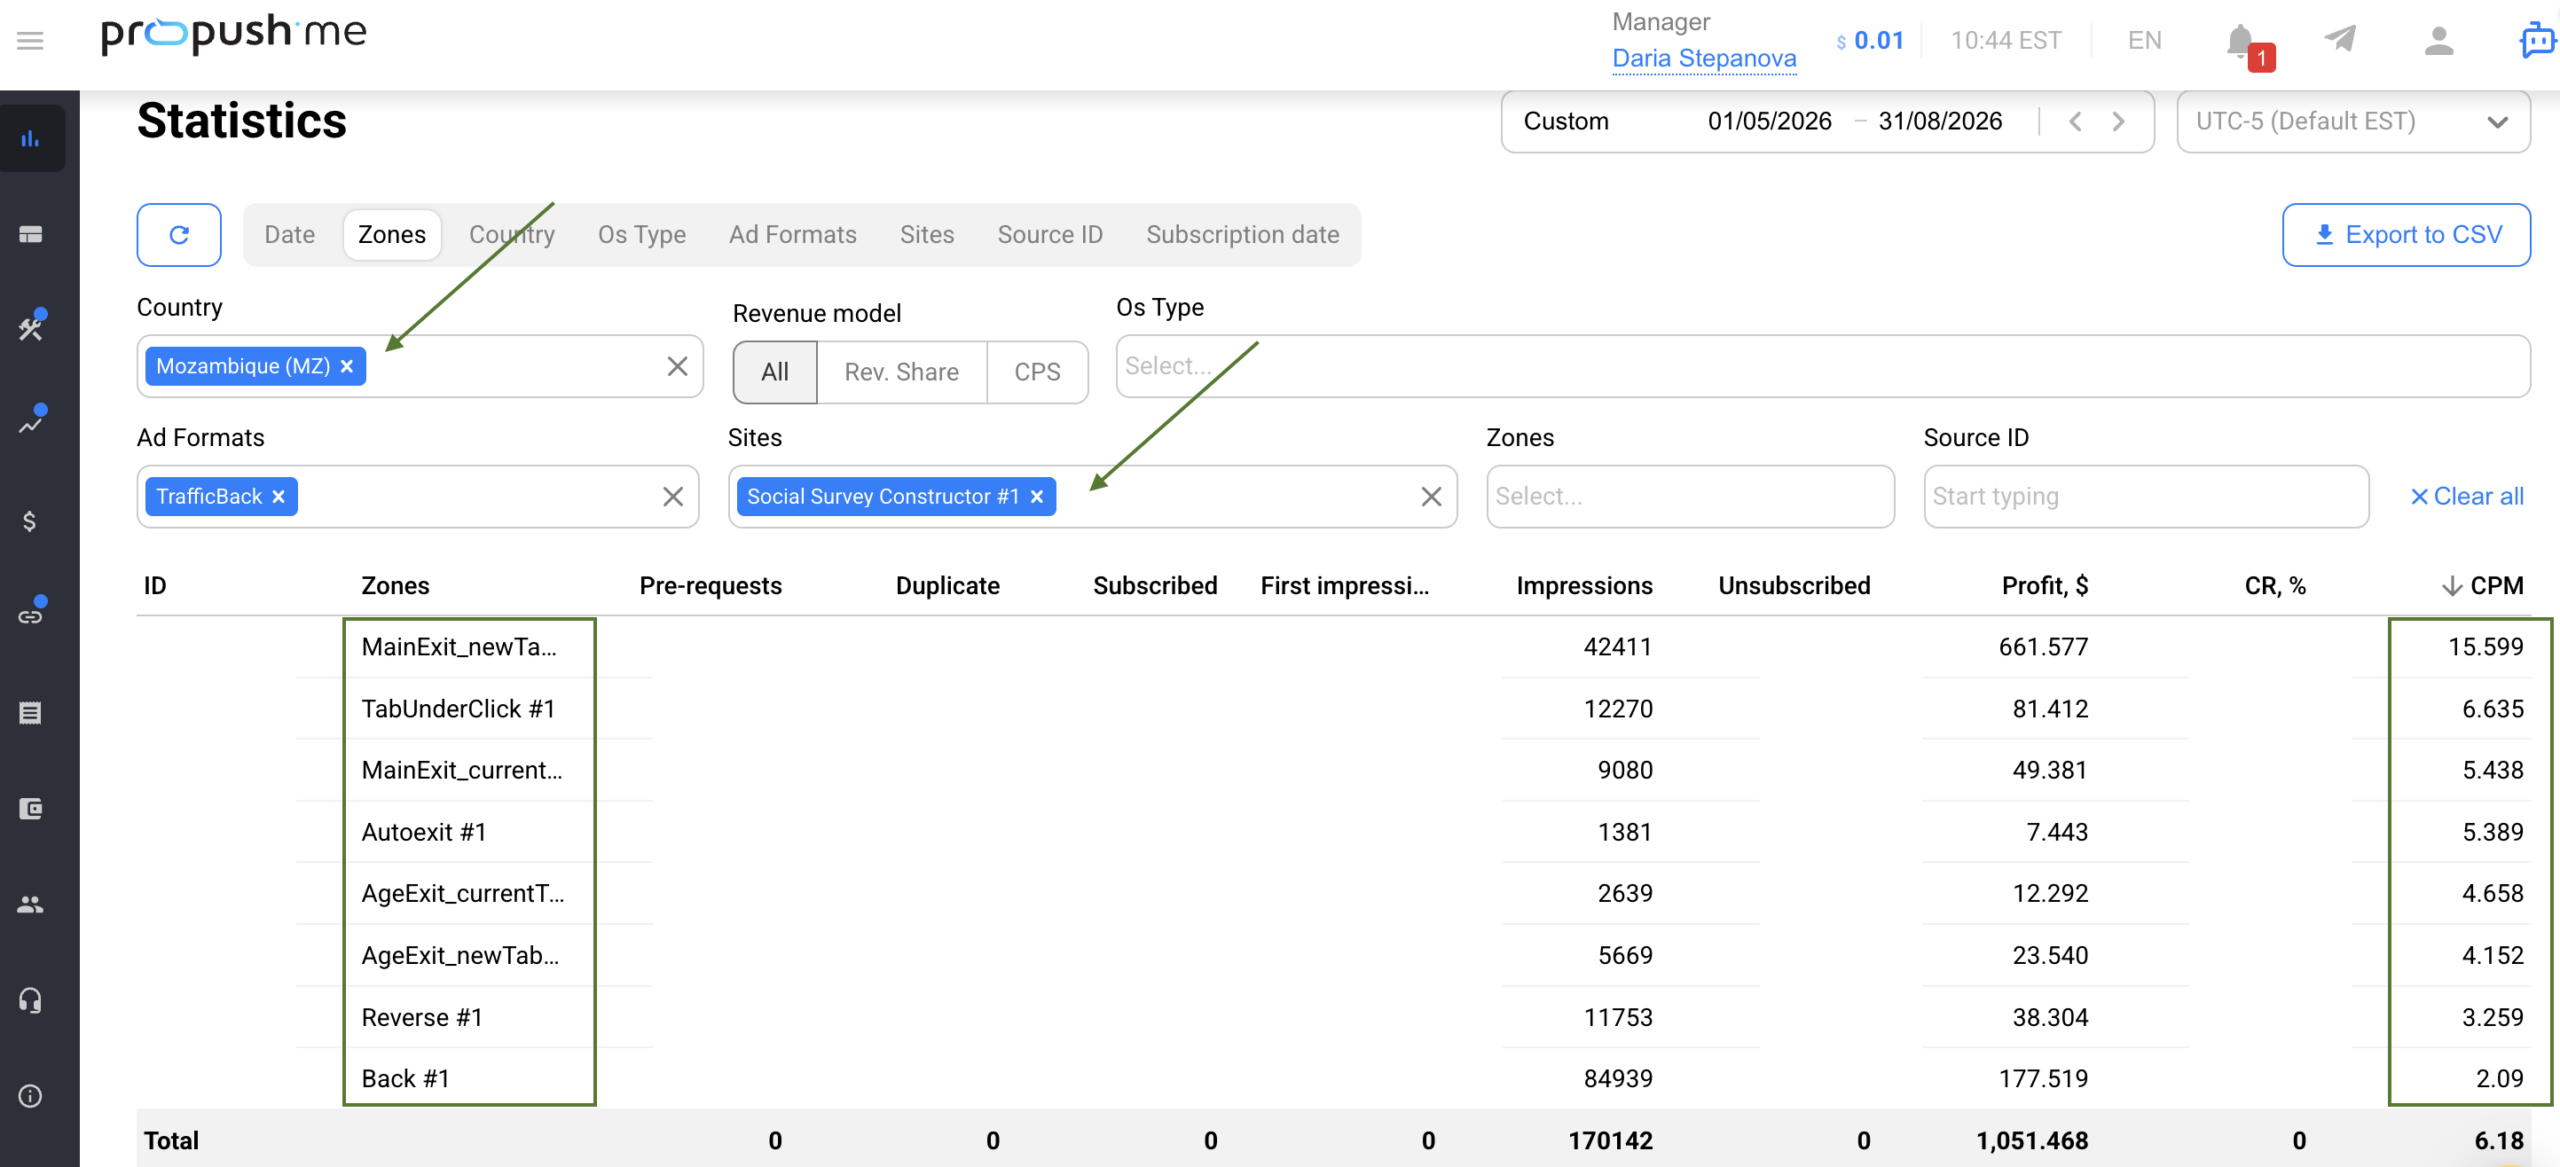
Check CPM by GEO and monetization zone, not just overall. June’s CPM was $6.988, compared to the $6.087 average, and a difference like that can change whether your CPR target still makes sense. When scaling a GEO, use that GEO’s numbers as your benchmark.
Apart from GEO, it’s important to remember that Constructor monetizes traffic across several zones, each corresponding to a different stage of user engagement. Main Exit represents the highest level of engagement, so its CPM will often be higher. Other monetization zones may show lower CPMs, which is completely normal.
In other words, check the Constructor exit breakdown, not just the overall funnel performance. The distribution across different exits gives you a much clearer picture of how the funnel actually worked: where users dropped off, which paths generated the most value, and whether one particular exit significantly outperformed the others.
Customize before you write a template off. Constructor templates are editable, and sometimes a few wording changes are enough to turn a weak landing page around. It’s one of the quickest and cheapest ways to see whether the flow is wrong for your traffic, or simply speaking the wrong language.
ProPush AI Assistant makes adjusting landing page copy and design even faster. You can use a simple chat to update copy, images, colors, CTAs, and other page elements, adapt the landing to a specific GEO, and create multiple versions for testing – without editing the code.
Was this publisher’s success down to luck?
Not really. He had a clear strategy and followed it to a T: starting at a low daily budget, giving promising ad sets enough time to prove themselves, watching the CPR closely, and scaling only when the numbers made sense.
For other publishers, the takeaway isn’t to copy Mozambique and Rwanda, chase an 18% CTR, or use $0.00323 as a universal CPR target. Those numbers belong to this campaign. What’s worth borrowing is the process: start small, find the benchmarks that make your own traffic profitable, and scale only after the results hold.
Want to try a similar setup? Open the Constructor in your ProPush account, choose a flow that fits your traffic, customize it, and start with a small test. If you’d like to see what the same tool can do with a much bigger budget, check out our earlier Constructor case study.
Big thanks to the publisher who shared his data, his creatives, and his reasoning for this case study.