
Shall you just patiently wait for further results? Well, this was the only option before — but not anymore.
Meet the new ProPush feature — Daily Cohort Revenue. It is a brand new way to analyze the payback of your daily cohorts –– all users who subscribed at a specific date. With Daily Cohort Revenue, you can now quickly check how much you earn from a chosen daily cohort and how much this cohort brings you while its users keep interacting with push notifications.
In this post, we will show you how to use this totally game-changing analytics tool.
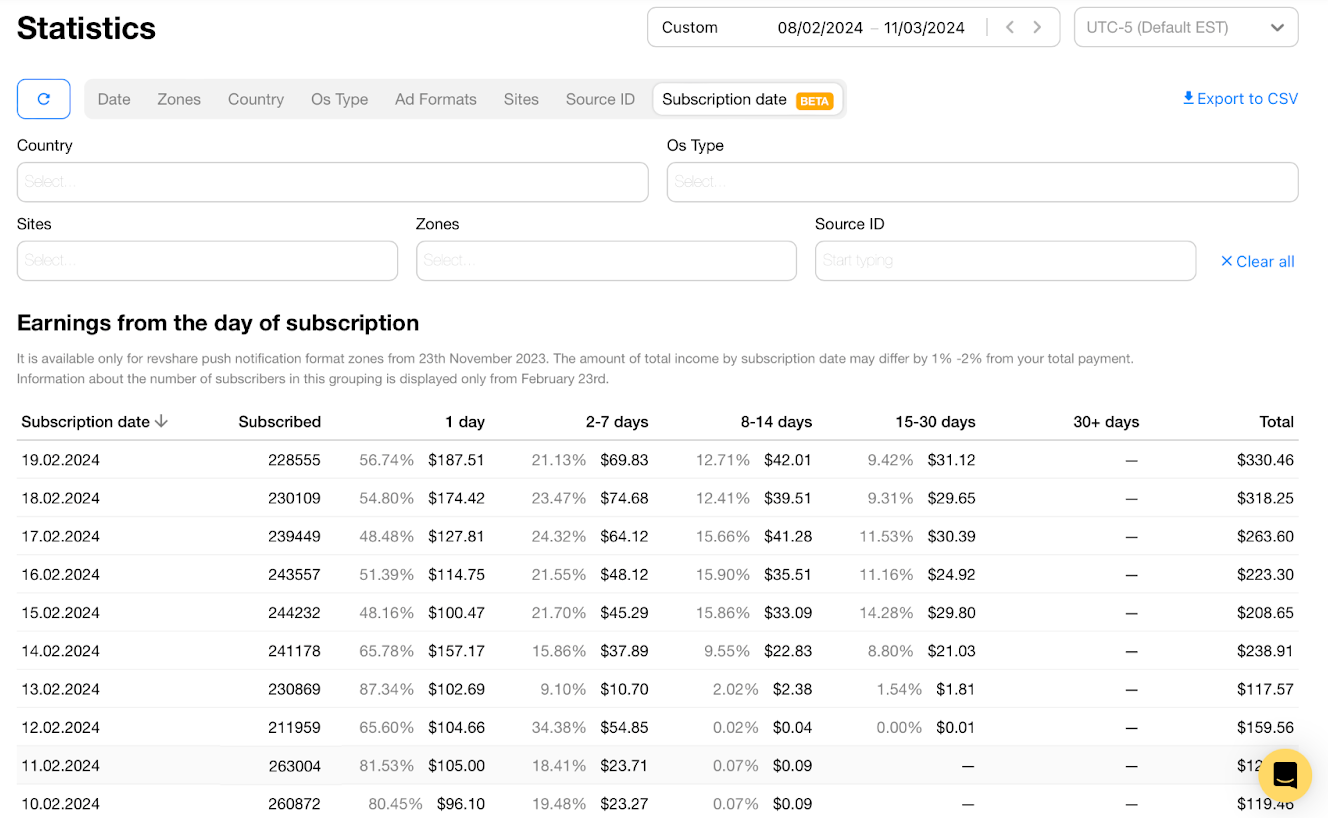
When you open your Statistics and switch to the Subscription Date tab, you will see the following table:

Each row shows a cohort of users who subscribed to your push notifications on a particular date. Let’s suppose today is the 8 of February and look at the highlighted row:
| Subscription date | Subscribed | 1 day | 2-7 days | 8-14 days | 15-30 days | 30+ | Total |
| 25.01.2024 | 201743 | 65.60% ($104.66) | 34.38% ($54.85) | 0.02% ($0.04) | 0.00% ($0.1) | – | $159.56 |
This row shows you that the cohort of users you brought on 25.01.2024 has generated $159,56 in total for now (till 8 February). The overall number of subscribers in the cohort is 201743.
The Days columns help you understand how quickly this cohort generated this revenue:
All these figures allow you to count the ROI of a particular cohort using the ROI formula:
| Net Profit / Cost of Investment X 100% |
Note:
Sounds clear enough, we suppose — but why do you need this information in your stats?
The first and most important way to use this tool is to estimate the value of your subscribers. In other words, the Subscription Date tab will answer the following question:
— When will the subscribers who came on a particular date pay off and start bringing profit?
Let’s look at one example to make things clear.
On December 1, you paid $1,000 to purchase traffic for your landing page and added a ProPush tag to this landing. Your page immediately began to collect push subscribers bringing profits! By January, this cohort of subscribers from December 1 brought an overall $2,000:

As you can see from the graph above, all this revenue didn’t come instantly. Instead, it was distributed like this:
This way, you can analyze revenue from every cohort of subscribers who joined on a particular date. It allows you to make predictions about your ProPush RevShare profits in the long term and understand the ROI of similar cohorts – according to the formula we left above, the ROI of this cohort was 100%.
It is now easily done under the Subscription Date tab without any complicated (and not always accurate) predictive models that users build in Excel and other tools.
However, that’s not everything — and the Subscription Date tab can be helpful in three more use cases. Here they are.
Use case: When you want to know what cohort is more profitable or count how much you earn from every subscriber.
Suppose you purchased Popunder traffic for $50 on February 19, and this traffic brought you a particular (228555) number of subscribers. You want to check how much revenue and profit you received from each as well as compare profitability of this cohort with others.
This will give you insights on traffic source performance on particular days, and you can decide whether to continue using these sources for push monetization.
Here are the two formulas you can easily use to calculate it with the help of the Cohort Revenue feature.
In our case, it is $330,46/228555 = $0.0014
($330.46-$50)/228555 = $0.0012
Let’s compare this cohort’s profitability with the one that was subscribed on February 13 when we used Social traffic as a source.
($117.57-$50)/230869 = $0.0002
The February 19th cohort turned out to be more profitable, which proves that Popunder traffic works better in this case.
Use case: When you want to compare how various GEOs perform with push subscriptions.
Suppose you began driving traffic from the USA, Brazil, and India. All subscribers who came on this day will be grouped into a cohort by subscription date. However, you don’t know precisely who will better interact with your notifications — Americans, Brazilians, or Indians.
This is where the new Daily Cohort Revenue comes into play. Just sort out the users by subscription date and then make another filter by country:
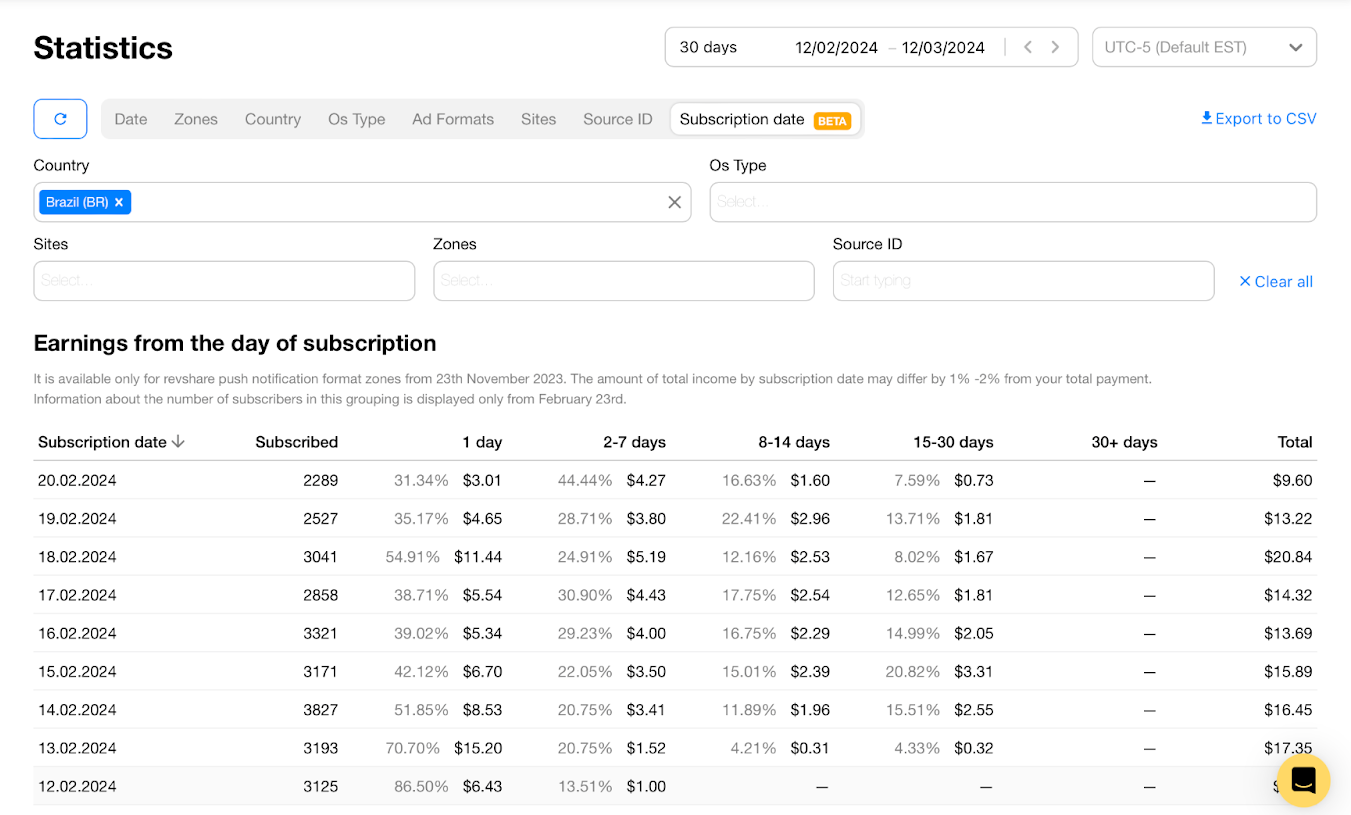
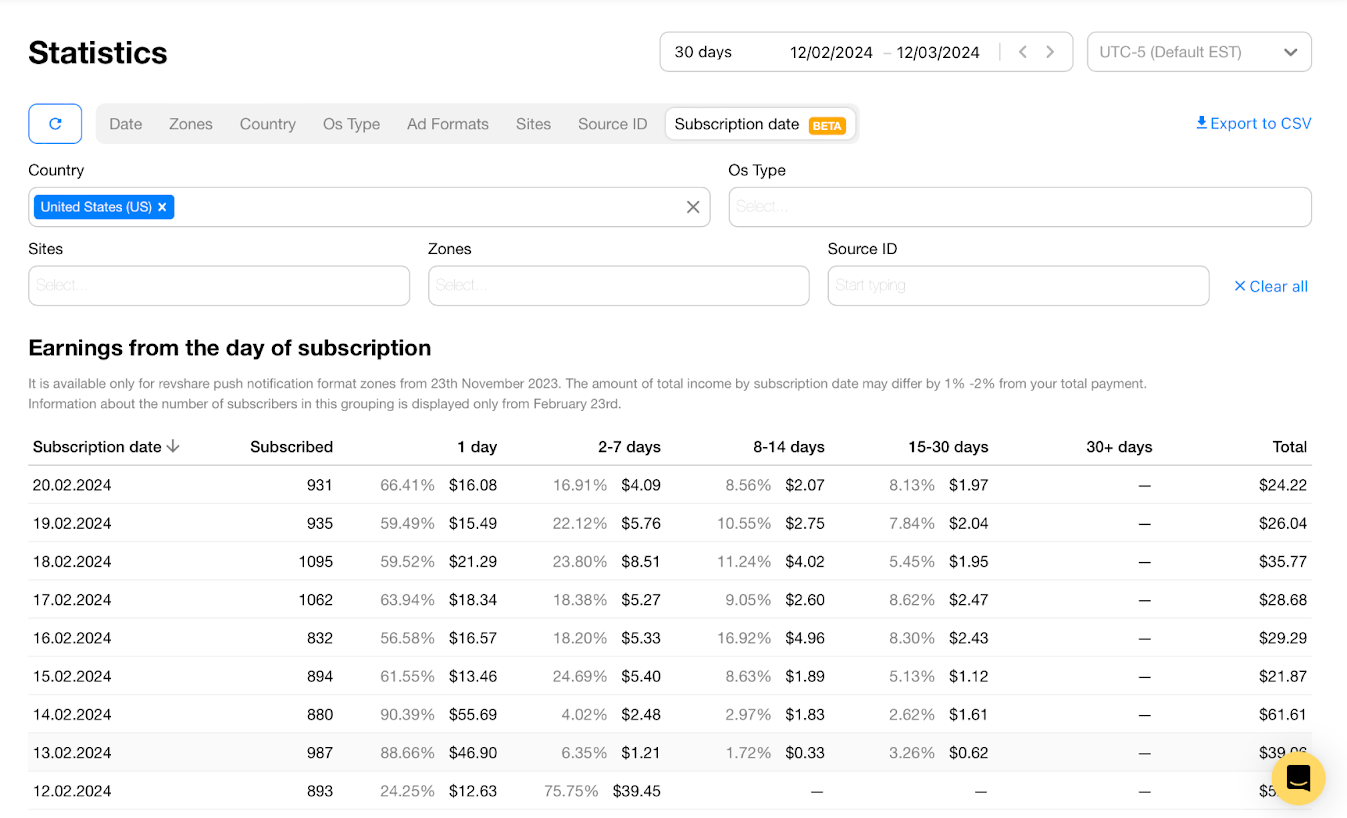
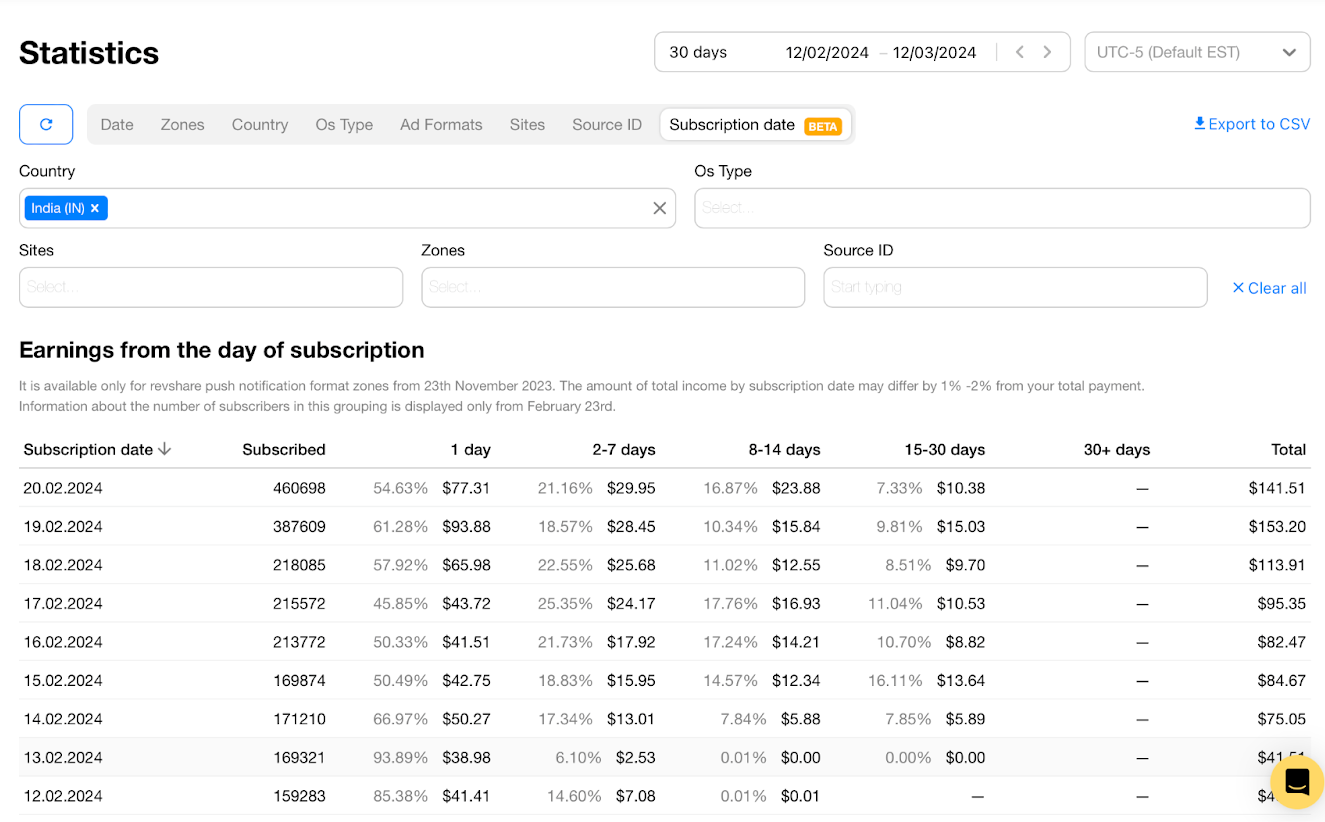
Voila, you see revenue from every GEO and can now start drawing more specific conclusions. For example, you can estimate how quickly a particular GEO pays off and distribute your budget accordingly.
For example, in this case, you might want to boost your spending for India and, on the contrary, reduce the budget for Brazil.
Use case: When you add a new landing page and want to check how it performs for your extra monetization.
Say you added a new landing page — or made some changes to the existing one.
Theoretically, this may affect the subscription rate — for example, you suppose your new design inspires more trust and motivates people to subscribe.
A Subscription Date + Site filter will give you a precise image of how the landing page affects your earnings:
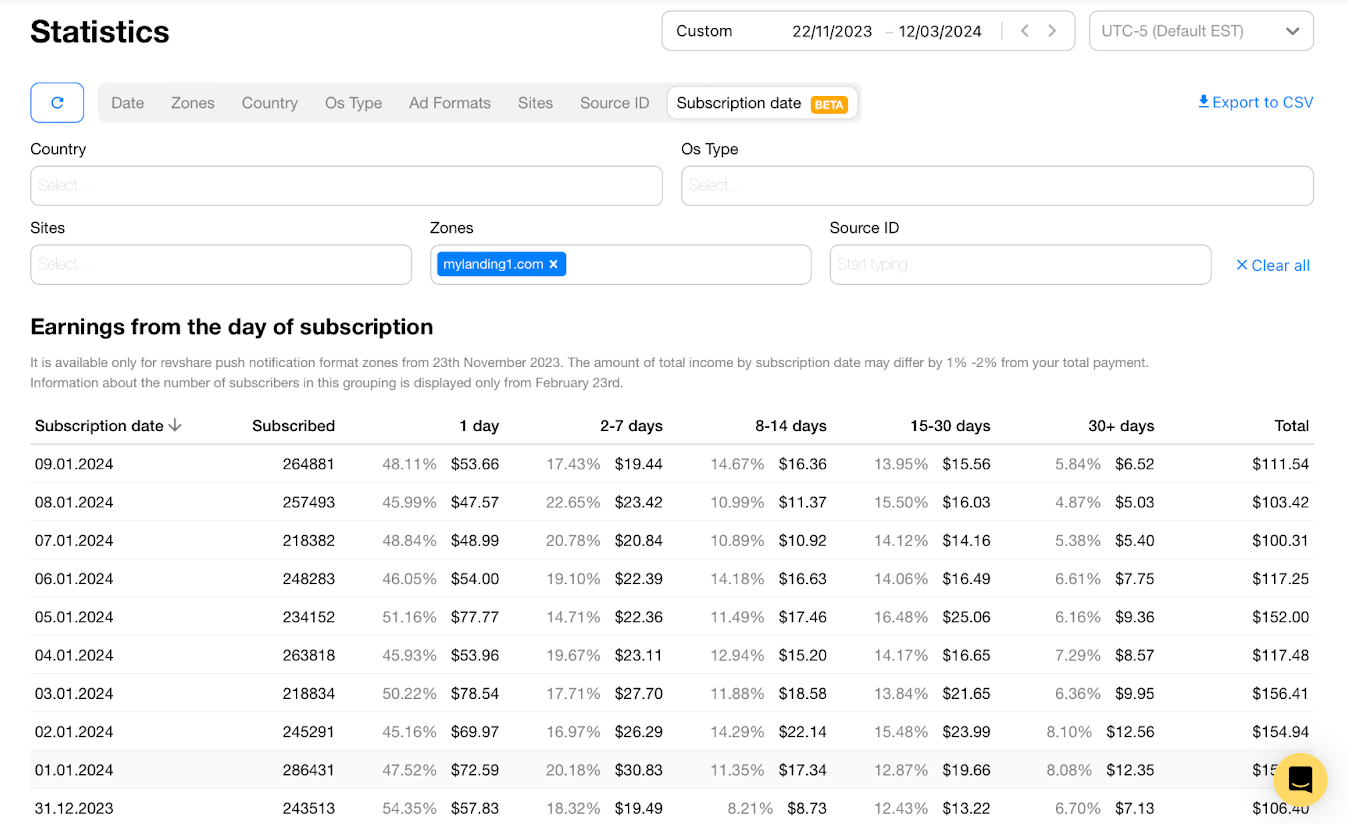
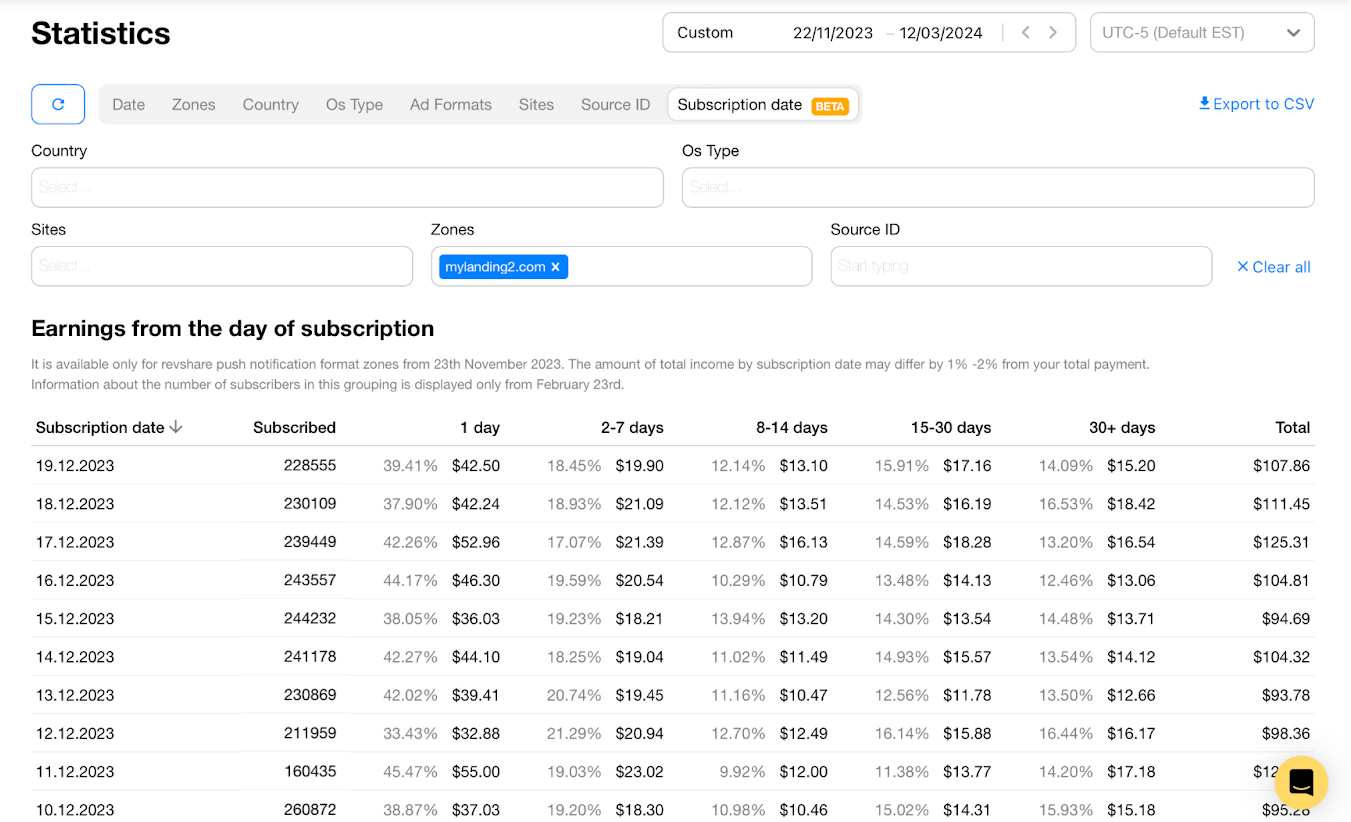
In this case, revenues are higher with the mylanding1.com page. If the numbers, on the contrary, worsen, try another landing or analyze how creatives might impact your revenue.
With a similar approach, you can estimate the traffic sources you switch on a particular day. For this, use the Zones filter.
We added 2 more columns to the table:

This breakdown helps you see what brought you more money: your subscribers or users monetized with TrafficBack – and adjust your monetization strategy accordingly.
The Daily Cohort Revenue is already in your account if you use RevShare — so come and test it right now. The new statistics will be available for the new cohorts you created after the feature release.
And, we want to make the product as good as possible for you – so please leave your feedback on the feature to your account manager!
Happy profits!